How to make sure that you are meeting daily targets using Processes Page in Supervision Module?
Overview
We are thrilled to introduce a cutting-edge redesign of the Processes Page, meticulously designed to bring unparalleled efficiency, visibility, and control to garment manufacturing. This update ensures a seamless production flow by optimizing process distribution and balancing machine utilization.
What is Line Balancing and Why is it Important?
Line balancing is the strategic allocation of work across different stations on a production line or section. It ensures all processes are evenly distributed and function at the same rate, preventing bottlenecks and minimizing downtime. A well-balanced section helps:
- Maximize Throughput – All production stages work in harmony, increasing overall output.
- Enhance Flexibility – Quickly adapt to new styles or fluctuating production volumes with minimal disruption.
- Improve Worker Morale – A fair distribution of work leads to higher job satisfaction and lower turnover.
Introducing the New Processes Page
 1. Visual Process Mapping
- The interactive graph/table provides a clear, real-time overview of process distribution and workload balance.
- Easily identify bottlenecks and make quick adjustments to improve efficiency.
2. Interactive Selection Tools
- Customize your view by selecting specific sections, styles, or orders to focus on optimizing a particular area of production.
3. Informative Data Tiles for Real-Time Monitoring
📌 Actual Production Tile
- Tracks the precise number of pieces produced in real time.
- Clicking on it reveals a detailed analysis per order, helping teams monitor production progress.
📌 Daily Target Tile
- Displays today’s target production based on AI-generated estimates or production order planning:
- If AI tool is used, targets are fetched from the AI model.
- If not, the system calculates the target by summing hourly production goals over the planned shifts for the order.
- Clicking the tile opens a detailed breakdown of daily targets.
📌 Real-Time Performance Tile
- Shows actual progress compared to the planned target up to the current time, using color-coded urgency:
- Green (100%+) – On track or exceeding targets.
- Orange (80%-100%) – Slightly below target.
- Red (<80%) – Production significantly behind schedule.
- Example: If the total daily target is 400 pieces and the shift is halfway through, the expected progress should be 200 pieces. The tile compares actual production against this interim goal.
- Users can toggle graph or table format for a preferred view.
Understanding the Table View
- Displays all processes, both mandatory and optional (optional processes are marked with a shuffle button).
- Users can search for specific processes for quick access.
- Each process card includes:
- Machine type required for that process.
- Assigned machines within the section.
- Names of logged-in employees working on that process on each machine.
- Work-in-progress (WIP) – Shows the number of pieces ready for the process based on dependencies.
- Last hour productivity – Displays the number of completed pieces in the last hour, excluding breaks.
- Progress bar – Indicates how much of the order/style is completed based on the cut quantity.
- Double-clicking provides additional details:
- Hourly output
- Production progress vs. requirement
- Assigned machines & personnel
Understanding the Graph View
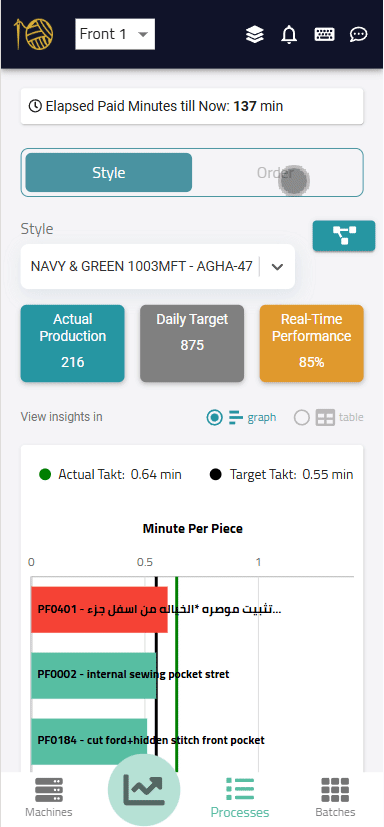
- Processes are displayed vertically in operational sequence, showing only mandatory processes.
- The X-axis represents actual production time (in minutes), providing insight into production speed.
Takt Time: Understanding Production Flow
Takt time represents the ideal pace at which products must be produced to meet demand. It plays a critical role in ensuring balanced workloads and preventing delays.
Key Graph Features
1. In-Depth Process Insights
- Hovering over or clicking a process bar reveals:
- Process name
- Actual takt time
- Work-in-progress (WIP)
- Overall progress rate
- Double-clicking provides additional details:
- Hourly output
- Production progress vs. requirement
- Assigned machines & personnel
2. Color-Coded Efficiency Indicators
- Green Bars – The process is operating faster than the target takt time.
- Red Bars – The process exceeds the target takt time, indicating potential bottlenecks.
- Grey Bars – The process has less than an hour’s work remaining or is already finished.
- Blue Bars – The system cannot determine takt time due to missing planned orders.
3. Key Takt Time References
- Target Takt Time (Black Line Reference) – Represents the ideal pace for each process, calculated by dividing available shift time by the target production quantity.
- If planned via the order production planning page, it considers all shifts planned for the order.
- If not, the system assumes the main shift to calculate available time.
- Actual Takt Time (Green Line Overlay) – Reflects the real takt time across the entire section:
- It is calculated by dividing elapsed shift time till now by actual produced pieces.
- Ideally, this matches the last process’s takt time, ensuring smooth production flow.
- If there is a mismatch, it may indicate inconsistent production pacing or bottlenecks at the final stage.
The Power of the Enhanced Processes Page
This new Processes Page does more than just display data—it provides actionable insights to improve production efficiency.
Key Benefits
✔ Balance Workloads – Evenly distribute tasks across the line to prevent worker fatigue and machine overload.
✔ Reduce Bottlenecks – Identify and resolve process imbalances that slow down production.
✔ Increase On-Time Delivery – Stay aligned with deadlines by tracking daily targets and real-time production.
✔ Optimize Resource Utilization – Ensure that machines and labor are used efficiently without excess idle time.
🚀 The enhanced Processes Page is now live – start optimizing your production flow today!
For any questions or support, our team is ready to assist you!
Related Articles
How To Manage Styles and processes?
&lt;br&gt; Every small variation in a cut needs its own settings and operations. This update makes sure managing those variations is organized and fast from the very first step. Styles | Creating and Managing Style Category Variations A ...New Release | Define Your Style Zones Once, Link Them to Quality Automatically (06-07-2026)
<br> Connect style zones to production operations and quality inspection. Quality checks used to happen without a clear record of which part of the garment each defect came from. Now you define your style zones once and the system links them to ...New Release | Define Style Zones Once, Link Them to Quality Inspection Automatically
&amp;amp;lt;br&amp;amp;gt; Accurate quality defect tracking starts one step before production: defining which parts of the style need to be monitored. This update puts that step where it belongs, inside the system. Zones | Linking Style ...New Release | More Accurate and Transparent Supervisor Evaluation with Clear, Measurable Criteria (15-06-2026)
To ensure a more fair and transparent evaluation process, we have updated the assessment criteria for Production, Quality, and Maintenance Supervisors with more precise and measurable standards. Discover the latest improvements. HR Module | ...New Release | Balance Your Production Line With AI Before Production Starts (30-06-2026)
&amp;amp;lt;br&amp;amp;gt; Line balancing used to depend on experience and personal judgment. Now the system calculates the best balance point for you based on actual data, in seconds. AI-Powered Production Line Balancing Finding the right ...